

Income Inequality and Its distortion on Global Sustainability Measures
Income Inequality and Its distortion on Global Sustainability Measures

The topic of global warming has filled our international forums in recent decades. We see a lot of effort being put in to address climate change and sustainability. The United Nations came up with SDG in 2015 with a target date of 2030. The main focus of these efforts is to curb carbon-based pollution from all aspects of life. While the world agrees that carbon emissions need to be curbed, there is high controversy over how to control them.
For background, here is the historical global carbon emissions graph from the World income inequality report. A quick look at the graph can explain the reason behind the controversies.

If we were to consider these data in its solidarity, different pictures emerge. If you consider the current emissions level, China becomes the biggest polluter and a prime target for carbon emission regulations. If you look at historical pollution levels, North America becomes the biggest polluter, followed by Europe. If you consider population, South Asia has by far the most population, hence the potential for future emissions. The single graph gives three different opinions. So, let us consider a graph normalized for population, i.e. – Global emissions per capita graph
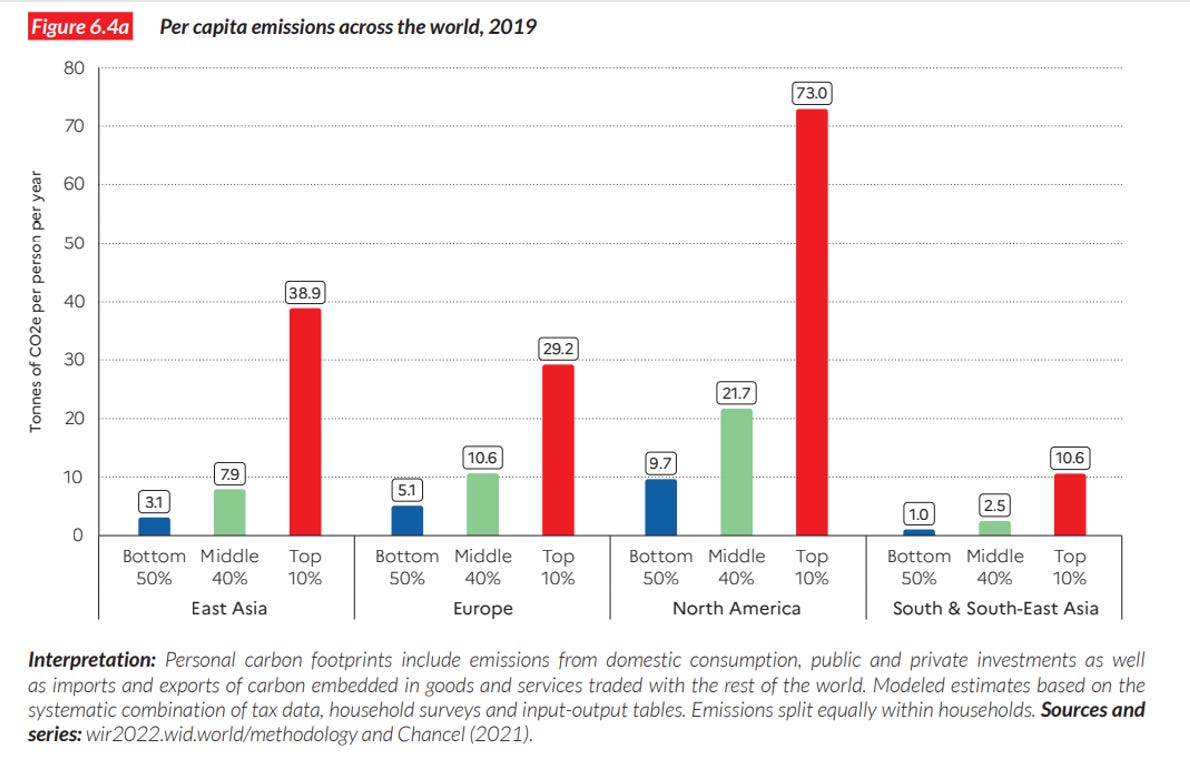
This graph gives different results again. The richest of East Asia has more carbon emissions than Europe, next only to the US. If you consider the average carbon emissions, the US tops the list with the heavily populated South Asia at the last. This graph demonstrates that carbon emission inequality correlates with income inequality. An interesting metric is that Europe’s overall carbon footprint is much smaller compared to the US on a per-capita basis. This demonstrates the effectiveness of its sustainable measures. If you look at global measures related to climate change, most of them are directed towards Africa, developing countries of Asia and Europe instead. While Europe manages to control its per capita emissions, the US doesn’t seem to do it with the same effectiveness. This may seem an easy solution to solve, but there is more.
Consider a remote village in Africa that needs electricity. In the conventional world, we build a large-scale power plant that would power hundreds of villages and towns at once. We would construct an electric grid to redistribute the power and use it effectively. Under the new green measures, they would need to use renewable power sources which are costly to set up. Since they can set it up at distributed locations, the need for a grid never arises. While distributed power systems seem to be effective, we miss out on savings from economies of scale. Energy-saving appliances and tech are generally more costly than regular tech, leading to higher initial costs. In the long term, the nation won't be able to scale up and provide a more efficient energy mix due to this initial bias. On other hand, Countries like the US have established power grids leading to huge economies of scale, giving savings to the economy. Thus, the incentives for sustainable power are misplaced ignoring long-term effects beyond direct carbon emissions.
If you consider the example of the US and Europe, they do implement green measures but the effects seem to be lesser than expected. The answer seems to be that income inequality plays a role. The richest 10 % have a disproportionate impact on carbon emissions. In such instances, regular rules don’t work that much. Ex – higher petroleum taxes (meant to discourage use) doesn’t affect consumption, move for electric cars just replace the petrol cars with the same number of Electric cars etc. There is high difficulty in imposing such green measures as they can easily bypass it than a common man. There is also an ever-looming threat of ‘Capital flight’ if the rules ever get too strict. The governments tread a thin line balancing both priorities.
With growing global emphasis on a push for sustainable consumption targeted at the common man, it’s time to ask “Are we asking the right person? "
Graphs sourced from World Income Inequality Report 2022